2026 LAND-USE AND LAND-COVER CLASSIFICATION
Mapping the Matang Mangrove Forest Reserve
A 10 m land-use and land-cover (LULC) classification of MMFR and its 5 km buffer, produced with Sentinel-2 imagery, Random Forest and Google Earth Engine.
CLASSIFICATION RESULT
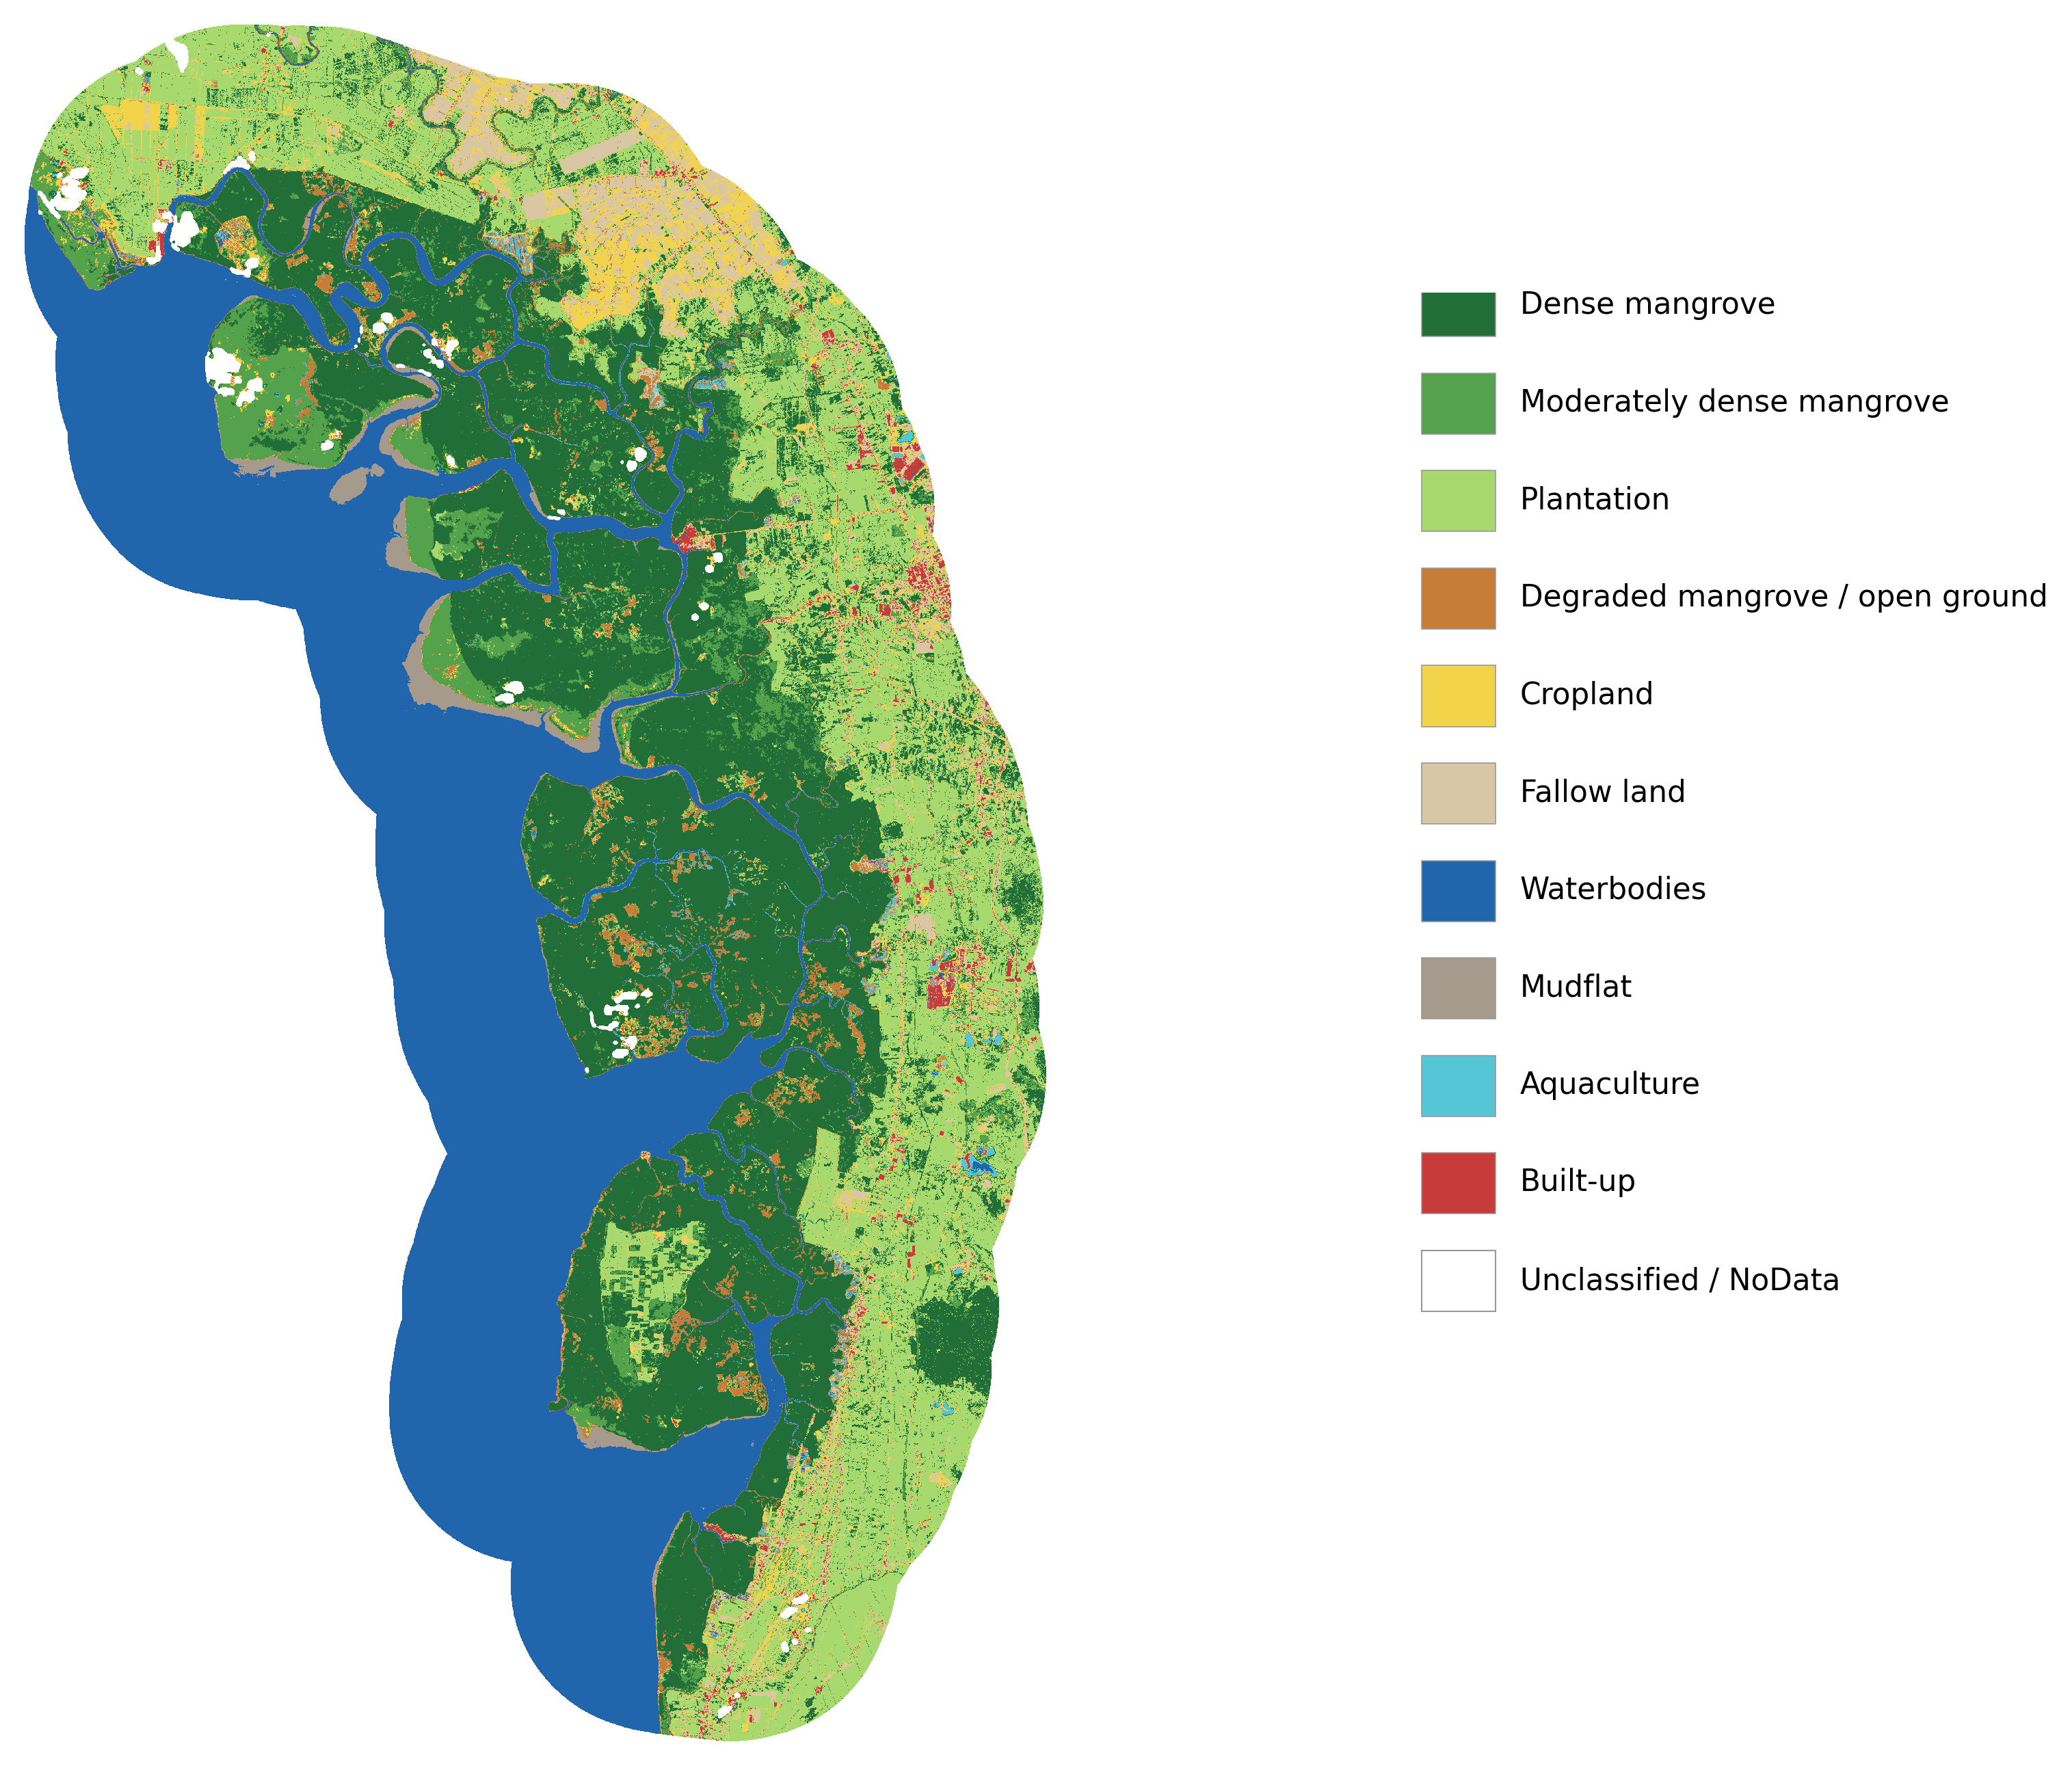
2026 land-cover map
The map shows the ten classified land-cover types across the study area.
AREA BY CLASS
Classification areas
Areas are reported in square kilometres (km²), as provided in the classification data.
| ID | LULC class | Area (km²) |
|---|---|---|
| 0 | Dense mangrove | 395.91 |
| 1 | Moderately dense mangrove | 63.16 |
| 2 | Plantation | 262.21 |
| 3 | Degraded mangrove / Open ground | 33.06 |
| 4 | Cropland | 54.33 |
| 5 | Fallow land | 44.59 |
| 6 | Waterbodies | 365.98 |
| 7 | Mudflat | 13.42 |
| 8 | Aquaculture | 6.33 |
| 9 | Built-up | 11.04 |
| Total classified area | 1,250.02 | |
| 255 | Unclassified / Cloud / Cloud shadow | 9.60 |
| Total study area (5 km buffer) | 1,259.61 | |
Class and study-area totals are reproduced from the source data; values may differ slightly when summed because of rounding.
HOW THE MAP WAS PRODUCED
Study area and method
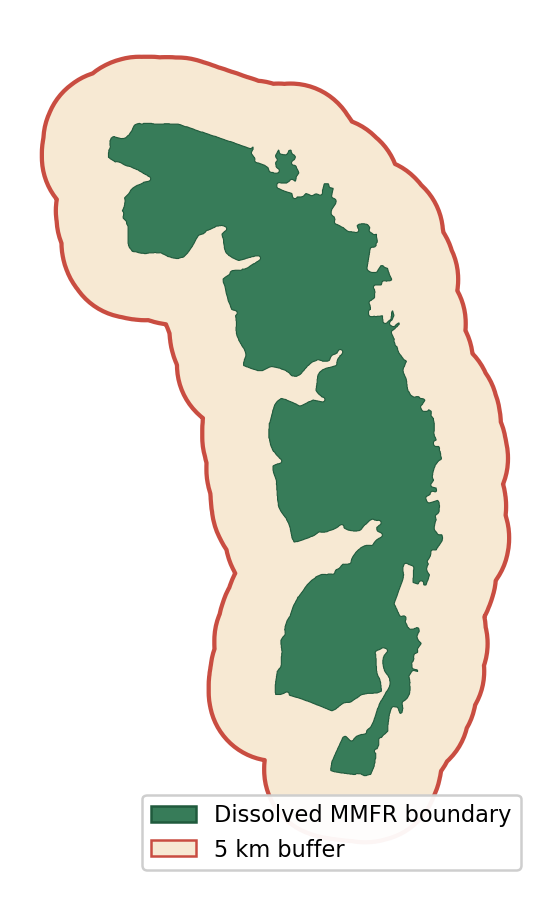
The original MMFR shapefile was dissolved into a unified reserve boundary. A 5 km buffer around that boundary defines the classification study area.
Sentinel-2 Level-2A surface reflectance imagery acquired on 22 May 2026 was selected for its low cloud cover (6%). Clouds and cloud shadows were masked using the Scene Classification Layer (SCL). After masking, 98.8% of the study area had valid data; 1.1% had missing data.
The predictor stack included ten Sentinel-2 bands (B2, B3, B4, B5, B6, B7, B8, B8A, B11 and B12) and five indices (NDVI, NDMI, MNDWI, NDBI and NDRE). A Random Forest model with 200 trees (seed 42) was trained using 439 polygons across the ten LULC classes.